Measuring content marketing ROI really comes down to one simple formula: (Net Return − Total Investment) ÷ Total Investment. When you line up production costs, attributed revenue, and the length of your time period, you get a clear picture of what your efforts are actually worth. On macOS, native tools like Apple Numbers, Excel for Mac, Quick Look, Automator, and Apple Shortcuts speed up the math so you can focus on insights, not manual data wrangling.
Core Formula And Key Metrics
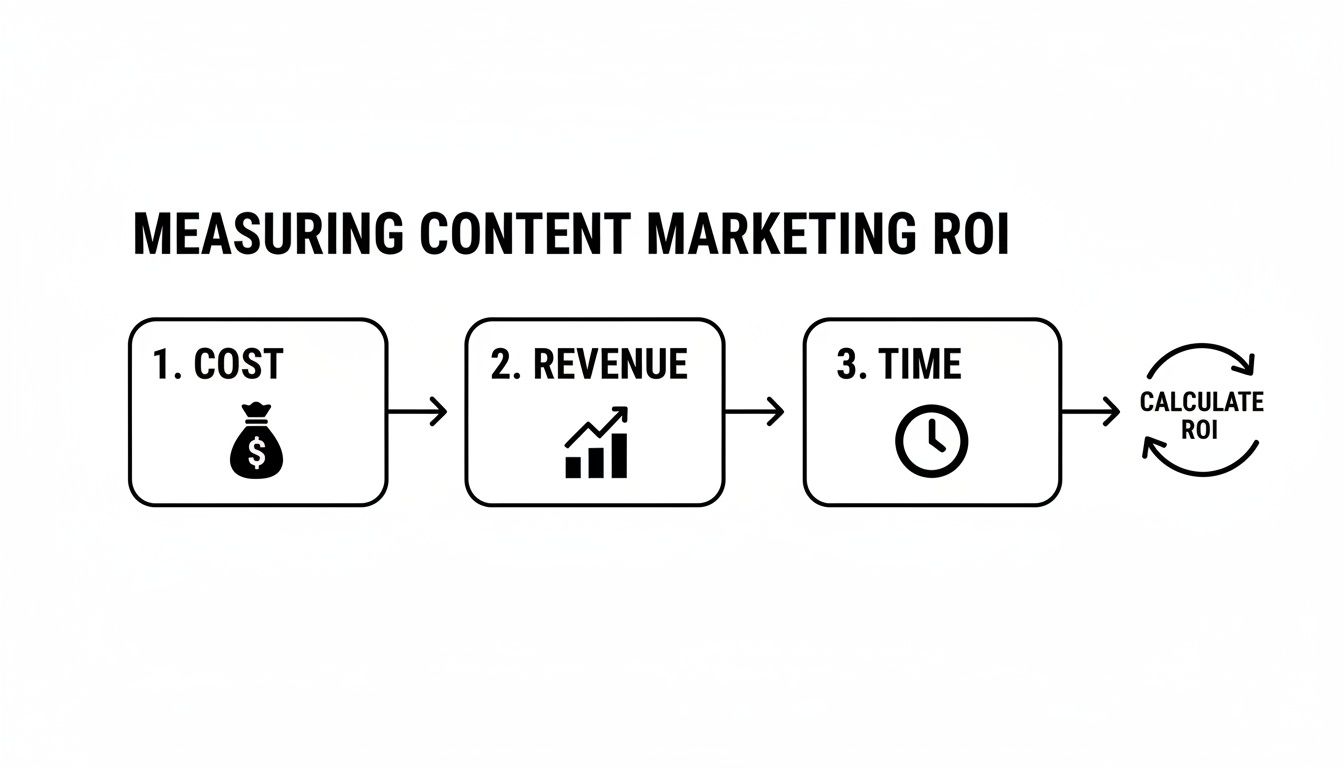
At its heart, the ROI calculation is straightforward: (Net Return ÷ Investment) × 100 gives you a percentage that shows profit beyond break-even. In practice, you’ll rely on:
- Production Cost: All fees for writing, design, video editing, and promotion.
- Attributed Revenue: The sales or leads that stem directly from each piece of content.
- Time Period: Whether you’re measuring daily, weekly, or monthly returns.
Accurate attribution means tracking every customer touchpoint—no one-size-fits-all shortcuts. Tweak your formula for each channel to avoid distorting results.
Mixing inconsistent timeframes or overlooking hidden expenses can skew your ROI by 20% or more.
Here’s how cost, revenue, and timing come together in a seamless tracking process:
Key ROI Metrics Comparison
Below is an overview of essential ROI metrics, the formulas you’ll use, and recommended macOS tools to analyze performance quickly:
| Metric | Formula | Use Case |
|---|---|---|
| Production Cost | Sum of creation + distribution fees | Budget planning in Numbers |
| Attributed Revenue | Sales or qualified leads per content asset | Dashboard reports in Numbers (or Excel for Mac) |
| Time Period | Chosen interval (days/weeks/months) | Trend analysis with Quick Look previews |
Starting with these metrics cuts setup time and puts you on solid footing.
Refine these basics with multi-touch models once you’re comfortable. For deeper strategies and real-world tactics, explore our guide on content marketing best practices.
Next, we’ll zero in on defining clear goals and matching your KPIs to the metrics that matter most.
Setting Clear Goals And Aligning KPIs
Nothing derails ROI tracking faster than vague objectives. Before you dig into data, clarify the outcomes that matter most to your bottom line.
Without well-defined targets, teams end up chasing every spike in page views or social mentions—metrics that look good on a report but don’t move the profit needle. I’ve seen campaigns chase vanity numbers for weeks, only to realize they never tied back to revenue.
In one case, our B2B SaaS group consolidated four overlapping KPIs into a single profit-center metric. We leaned on HubSpot dashboards and synced live exports into Apple Numbers for deeper analysis.

Here’s what we zeroed in on:
- Cost Per Lead: Tracks how much each new trial or sign-up costs, so you can spot when acquisition gets expensive.
- Content-Driven Conversion Rate: Measures the percentage of readers who take action—like starting a demo—after consuming your content.
- Customer Lifetime Value (CLTV): Projects the total revenue each content-driven customer generates over their relationship.
Mapping each goal to one clear KPI aligns every team member—and even the CFO speaks the same financial language.
Content marketing consistently delivers strong returns with B2B strategies averaging a 3:1 ROI, meaning $3 earned for every $1 invested—far surpassing paid advertising’s $1.80 per dollar for ongoing organic traffic and leads without recurring costs. Explore those ROI insights
By ditching vanity stats like raw page views and social mentions, you stay focused on metrics that truly drive growth.
Choosing The Most Impactful KPIs
Not every metric is worth the effort. We rate each potential KPI against three criteria:
- Revenue Impact: How directly does it drive profit?
- Tracking Complexity: What’s the setup time, and how reliable is the data?
- Goal Relevance: How closely does it tie to your main objective?
Our team built a simple scoring table in Numbers, assigning values from 1–5 for each criterion. The combined totals highlighted the top two metrics—and everything else got parked.
A quick bar chart made outliers jump off the page, so we immediately saw that Cost Per Lead far outshone page views in terms of impact.
Building A Focused Tracking Framework
With your KPIs chosen, it’s time to automate. On macOS, we link HubSpot CSV exports directly to Numbers using a scheduled sync.
In our summary sheet we:
- Define named ranges for each KPI, making chart references painless.
- Use pivot tables to slice data by campaign, region, or content type.
- Apply conditional formatting so red and green flags pop up without scrolling.
Within two weeks, this setup slashed manual reporting by 50%, freeing us to dig into strategy instead of wrestling with spreadsheets.
Maintaining Focus And Dropping Vanity Metrics
A lean framework only stays lean with regular upkeep. We block off 30 minutes each week for a quick KPI audit.
If a metric hasn’t shifted more than 5% in three months or no longer ties back to profit, it moves to an archived sheet. In Numbers, we tag each KPI as Active, Archived, or Under Review.
This habit keeps our dashboard clean, our discussions revenue-focused, and every metric accountable to growth. When goals change, the right KPIs are already in place to reflect those shifts.
Gathering Data With macOS Tools
Accurate ROI hinges on dependable data from every channel.
On macOS, you can pull campaign stats from Google Analytics, HubSpot, and social platforms straight into Numbers or Excel for Mac. It feels just like working in any spreadsheet you already know—no endless copy-pasting required.
By tapping into APIs with shortcuts and lightweight scripts, your figures for campaign cost, attributed revenue, and engagement metrics always stay up to date.
- Google Analytics exports as CSV via Terminal scripts
- HubSpot automations feeding Numbers through Automator
- Social stats synced with macOS Shortcuts and webhooks
Automating UTM Tracking With Apple Shortcuts
Apple Shortcuts takes the grunt work out of UTM tagging. You can build a shortcut that adds UTM parameters to any link, logs each click, and drops the data into a Numbers sheet. All while staying inside macOS’s privacy framework.
- Append UTM codes automatically when you share a link
- Send click records to Zapier or IFTTT via webhook
- Save resulting CSVs in iCloud Drive for instant access
Schedule these shortcuts to trigger whenever you distribute content. That way, every URL uses the same tags—crucial when you start measuring ROI.
Scheduling Exports With Automator and Terminal
Automator can handle repetitive exports in one go, and a Terminal cron job ensures they run on schedule. Your daily CSVs land in iCloud Drive without lifting a finger.
| Tool | Function | Benefit |
|---|---|---|
| Automator | Export CSV from web interfaces | Eliminates manual clicks |
| Terminal | Schedule workflows via cron | Guarantees daily data freshness |
| iCloud | Sync files across all your Macs | Keeps everyone aligned |
Once Numbers watches that folder, charts and pivot tables refresh themselves. Stakeholders always see the freshest ROI numbers.
Real Example Of Data Pipeline
A content team I consulted with used Spotlight saved searches to spot new campaign CSVs in a shared iCloud folder. Editors’ Macs picked up each file, and a shared Numbers template refreshed visuals automatically.
- Spotlight finds files by naming pattern
- iCloud distributes them to every machine
- One Numbers file updates charts on its own
Automating this pipeline cut reporting time by 50% and gave us a clear audit trail.
Video views, blog sign-ups, and email opens funneled into a single dashboard—zero extra clicks. Clear file structures and shortcut labels made training new team members almost effortless.
Maintaining Consistent Data Feeds
Consistency is the secret sauce. A small typo or folder shuffle can break the chain.
- Prefix CSV filenames with YYYY-MM-DD
- Standardize UTM parameters across campaigns
- Organize exports in dated iCloud Drive folders
Run a quick audit each month. A simple review saved us from a data gap that would have skewed ROI calculations by over 15%.
A brief monthly check saved us from a data gap that would have skewed ROI calculations by over 15%.
You can also add Slack alerts or Automator-triggered emails to nudge stakeholders when daily updates arrive. Once every step runs itself, your team shifts from chasing numbers to shaping strategy.
Start building your macOS data pipeline today.
Sponsored by the makers
Tired of boring screen recordings?
Try Screen Charm.
Auto-zoom, motion blur, camera overlay, and background music. All built in. Record once, export a polished video.
See what it doesCalculating ROI Using Proven Formulas

Numbers alone rarely tell the full story. When our team dove into a digital agency’s latest effort, we saw how overhead and hidden costs reshape the bottom line. To cut through the noise, you’ll need a handful of go-to equations—net return, ROI percentage, cost per lead, and multi-touch attribution.
- Net Return shows actual profit by subtracting total investment from revenue.
- ROI Percentage converts that profit into a single, easy-to-read figure using ((Net Return ÷ Investment) × 100).
- Cost Per Lead highlights efficiency by dividing spend by new leads.
- Multi Touch Attribution assigns weight to each customer interaction for a clearer channel breakdown.
Net Return Calculation
True profit lives in net return, not gross revenue. In one 90-day campaign we saw $50,000 in income against $15,000 of spend. That leaves $35,000 to reinvest or pocket.
| Detail | Amount |
|---|---|
| Gross Revenue | $50,000 |
| Total Investment | $15,000 |
| Net Return | $35,000 |
Adjusting For Overhead Costs
Overhead can erode the clearest numbers—think tool subscriptions, salaries, and design assets. By tapping into AppleScript we set up a simple routine that:
- Pulls production hours from a CSV log
- Multiplies each entry by an hourly rate stored in a named cell (overheadRate)
- Updates every morning so reports always reflect true costs
This extra layer ensured our net return stayed honest after a 15% overhead allocation.
Cost Per Lead Breakdown
Slashing ad spend without insight is guesswork. Over 90 days, the agency generated 300 qualified leads on that $15,000 budget—working out to $50 per lead. From here, you can fine-tune budgets channel by channel.
- Highlight your top-performing sources in Apple Numbers with conditional formatting.
- Automate A/B ad tests via AppleScript and pipe results straight into your sheet.
- Move underperformers into an “Archive” folder on iCloud to keep your workspace uncluttered.
Optimizing Cost Per Lead
Match click-through rates against conversion percentages to spot outliers. On macOS, a quick chart in Numbers can reveal campaigns that win clicks but flop at lead gen—or vice versa.
Multi Touch Attribution Models
Assigning credit across every milestone paints a richer picture. In our weighted approach the team gave 40% to first touch, 20% to mid-funnel interactions, and 40% to that final click.
Key Takeaway: Distributing credit this way often uncovers hidden gems—one blog post or email drip might be more powerful than you thought.
Extending Calculations Over Time
A 90-day view surfaces trends a single week won’t. We sliced performance into three 30-day chunks and discovered a 25% net return spike in month two after cranking up social posts.
- Compare each segment’s ROI side by side in Numbers.
- Flag any period where ROI tops 20% using conditional formatting.
- Shift your content mix based on those peaks and troughs.
Building Custom Calculators In Numbers
When your spreadsheet updates itself, you avoid manual errors and wasted hours. Here’s how our team set up a live ROI tool:
- Define named ranges for revenue, investment, and leads so formulas never break.
- Enter each ROI calculation referencing those names for instant clarity.
- Link your CSV export folder so macOS Shortcuts can drop fresh data into the sheet.
- Build a dynamic chart that redraws whenever inputs change.
- Save the file as ROI-Template.numbers and make a copy for every new campaign.
Applying Shortcuts For Continuous Updates
Automating data imports means you spend less time clicking and more time strategizing. We built a Shortcut that grabs the latest CSVs, populates our template, and then sends a summary to Slack.
- Schedule it to run at a set time each morning through the Automation tab.
With these formulas, scripts, and automations in place, you’ll focus on tweaking strategy instead of trudging through spreadsheets.
Next up: syncing dashboards across macOS for live, at-a-glance insights.
Leveraging macOS Analytics Integrations
When everything lives on macOS, you can pull every KPI into a single dashboard. By tying together Apple Numbers, Übersicht, and Automator, you banish data silos and speed up your insight cycle. Suddenly, fragments of information converge into one clear picture of ROI.
Team workflows become smoother the moment CSV exports from your CRM land straight into a spreadsheet. Scheduling those imports means your content stats refresh automatically, removing the need for manual uploads. The result? Quicker, more trustworthy ROI calculations.
Desktop widgets act like a dashboard that never closes. Pin charts to your screen and catch trends before they slip through the cracks.
Syncing CRM Data Into Numbers
Most CRMs offer scheduled CSV exports via email or webhooks. Automator can grab these files automatically and push them into Numbers. That means your revenue figures and lead tallies update the moment a new report arrives.
- Kick off an Automator workflow that pulls weekly CSVs from your CRM.
- Define named ranges for Leads Generated and Revenue Attributed in Numbers.
- Set up conditional formatting to flag campaigns falling short.
- Store your spreadsheet in iCloud Drive for instant team access.
The moment the sheet syncs, all your charts refresh without any extra clicks. No more digging through emails or wrestling with copy-paste. You’ll know exactly how each campaign is performing at a glance.
Querying Databases With SQLPro
Sometimes spreadsheets can’t touch the depth of your database logs. For exact counts—like content-driven conversions—connect SQLPro directly to your marketing store. A targeted query is all it takes to pull those raw transaction records.
| Tool | Strength | Tip |
|---|---|---|
| SQLPro | Lightweight for single Mac | Save your go-to queries for lightning-fast reporting |
| DataGrip | Advanced schema navigation | Run through an SSH tunnel to keep your data locked down |
With this setup, you’ll ship fresh numbers each morning without jumping between tools. Add a brief AppleScript and your daily CSV exports happen on autopilot.
Embedding Live Widgets On Desktop
Desktop widgets are like a silent partner for anyone living in Numbers or a database. Übersicht lets you pin bar graphs, funnels, or trend lines directly onto your screen.
Pinning live charts helped a content lead notice a 15% drop in click-through rate within hours, not days.
Aim each widget at one critical figure—Conversion Rate, Cost Per Acquisition, or another metric that matters. Then tuck them into your workspace so they’re always in sight but never in the way.
Automating Updates With IFTTT And Automator
No one wants to chase down spreadsheets or struggle with outdated numbers. A smart pairing of IFTTT and Automator can fire off alerts whenever your Numbers file changes.
- Craft an IFTTT applet that monitors your iCloud Drive for new CSVs.
- In Automator, trigger that applet right after each import finishes.
- Have IFTTT send chart snapshots straight into Slack or email.
Suddenly your team talks about real-time metrics, not yesterday’s data. Forget last-minute PDF hunts—everyone sees the latest insights as they land.
Integration speeds marketing analysis across teams and boosts alignment.
Explore deeper macOS data integration with social analytics in our guide on social analytics tools.
Stakeholders immediately notice the smooth handoff between numbers and presentations. A quick chart export from Numbers into Keynote (stored in iCloud) means your slide deck refreshes itself each week. With those Keynote files in the cloud, every stakeholder opens the same, up-to-the-minute report.
Once the pipeline is humming, reviewing performance becomes a matter of minutes, not hours. Early warnings—triggered by desktop alerts—let you catch odd spikes or dips before they turn into surprises. From any widget or chart you can hop straight into Numbers for a deeper dive.
All of this means reporting shifts from a dreaded chore into a strategic gateway. You’ll make faster calls, iterate campaigns more effectively, and ultimately boost ROI year after year.
Get started now and completely simplify your analytics.
Optimizing Channels And Formats For Better ROI
Measuring content marketing ROI on macOS reveals some clear winners. Short videos tend to outperform detailed blog posts because they hook viewers in the first few seconds.
In fact, 71% of video marketers report that bite-sized clips generate the best ROI, and they deliver results 49% faster than text-based articles. Read the full video ROI research at Sprout Social
- TikTok Reels – Export views and click data from TikTok Business Center and import into Apple Numbers for side-by-side comparison.
- Instagram Reels – Grab CSV reports from Instagram Insights and then pivot the data in Numbers to surface your top clips.
- Long-Form Blog Posts – Pull pageview and conversion stats from Google Analytics exports, then plot trends in Numbers charts.
macOS Video Analytics Tools
On macOS, I automate CSV imports from YouTube Studio, TikTok Business Center and Instagram Insights. I’ve set up a simple Automator workflow that drops each download into an iCloud folder. From there, Numbers refreshes charts automatically.
- Export CSVs from each platform dashboard.
- Create an Automator folder action to move new files into your Numbers ROI template.
- Refresh pivot tables and charts in Numbers to compare watch time, completion rate, and clicks across channels.
Key takeaway: Automating this routine saves me hours every week and guarantees accurate ROI comparisons.
Case Study On Headline Testing
I worked with a SaaS team that split-tested two blog headlines in one Numbers sheet. Over ten days, the more action-driven title delivered a 23% lift in downloads. This experiment proved you don’t need fancy software to spot real opportunities.
- Compare variants side by side using paired columns.
- Run the test for a set window (7–14 days) to smooth out daily traffic swings.
- Zero in on conversion rates rather than just pageviews to gauge true ROI.
Repurposing Webinars Efficiently
A single webinar can spawn blog posts, email sequences, and social snippets with very little extra effort. I record on Screen Charm and export the transcript to draft posts. Next, I carve that text into email bites and pull out 30-second clips for social.
- Outline a blog post using transcript sections as headers.
- Set up a drip campaign in Mail to share key insights over two weeks.
- Trim highlights in Screen Charm, add captions, and schedule reels.
Check out our how to create engaging content guide for more tips on grabbing attention and boosting ROI.
Scaling Your Efforts
Once you know which formats move the needle, double down without stretching your team too thin. Clone your Numbers template for each new experiment so historical data stays intact. Then send a daily summary email that pinpoints the top performer.
Focusing on your highest ROI channels can increase overall returns by up to 30% within a quarter.
- Rotate content types to keep your audience interested.
- Stick to clear naming conventions and UTM tags for reliable tracking.
- Conduct monthly audits in Numbers to archive stale tests and tweak templates.
By repurposing proven formats you’ll save time and see ROI multiply—all without extra budget. Start with those short videos and transcripts; you might end up doubling your impact with half the effort.
Frequently Asked Questions

Below are practical solutions for the trickiest parts of measuring content marketing ROI on macOS—attribution, automation, cost tracking, and scaling.
Which Attribution Model Works Best
When you’re running multiple campaigns, a weighted multi-touch approach usually wins. Allocate percentages to your first interaction, last click, and critical touchpoints. Then plug those weights into Numbers (or Excel for Mac) to get a clear breakdown of which channels really move the needle.
How To Automate Daily ROI Reports
I set up Apple Shortcuts (and Automator for legacy workflows) to pull CSVs from analytics every morning. A custom Numbers template refreshes charts instantly, and IFTTT pushes the final report into Slack or email so the team sees updates without me lifting a finger.
Consistent automation can slash your reporting workload by 50%, keeping everyone aligned and informed.
How To Account For Overhead And Production Costs
Create a master cost sheet in Numbers and link it straight into your ROI calculator. That way, every element—from copywriting to video editing—is accounted for before you assess returns.
- Writing Costs: Log freelance or in-house hours directly in Numbers.
- Design Costs: Include licensing fees for stock photos or custom illustrations.
- Video Editing Costs: Factor in editing time with Screen Charm for a true view of your spend.
How To Scale ROI Tracking As Your Team Grows
Once you hit three or more contributors, a central dashboard becomes essential. I recommend hooking Übersicht or your favorite BI tool to live data feeds via SQLPro or DataGrip. Agree on naming conventions and UTM standards up front so new hires can jump right in.
With this setup, measuring ROI on macOS turns into a well-oiled machine—minimal spreadsheet wrangling, maximum insights.
Ready to produce engaging product videos and demos quickly? Start with Screen Charm today.
Enjoy unlimited 4K exports, dynamic zoom controls, and a zero-learning-curve experience.