
How to Measure Training Effectiveness and Prove Its Value
Measuring training effectiveness is all about a systematic look at how a program actually impacts an employee's knowledge and skills, and, most importantly, the company's bottom line. It’s a shift away from just handing out satisfaction surveys. The real goal is to connect learning initiatives directly to performance improvements and tangible results, like a jump in productivity or a drop in operational costs.
Why Proving Training Value Is a Game Changer
Let's be honest: proving the value of corporate training can feel like an uphill battle. For too long, Learning and Development (L&D) has been stuck in the "cost center" box, with success measured by vanity metrics like course completion rates. That approach completely misses the point.
Knowing how to measure training effectiveness isn't just a nice skill to have anymore; it's a strategic imperative. It's what turns L&D from a line-item expense into a powerful engine for business growth. When you can draw a straight line from a sales training module to a 10% increase in quarterly revenue, you're not just justifying your budget—you're proving your department's undeniable impact.
This is how you get a seat at the leadership table. Executives speak the language of data: efficiency, productivity, and profitability. When you can tie your learning programs to these core business objectives, you start telling a story that resonates, one backed by hard evidence.
For example, a well-designed onboarding process can get new hires up to speed 50% faster. If you're interested in that, you can dive deeper into the best practices for employee onboarding in our detailed guide.
The Four Levels of Evaluation
So, how do you actually do it? The process generally unfolds across four key stages. You start with the immediate participant feedback and work your way up to measuring the ultimate business impact. It’s a progressive model that gets more strategic at each level.
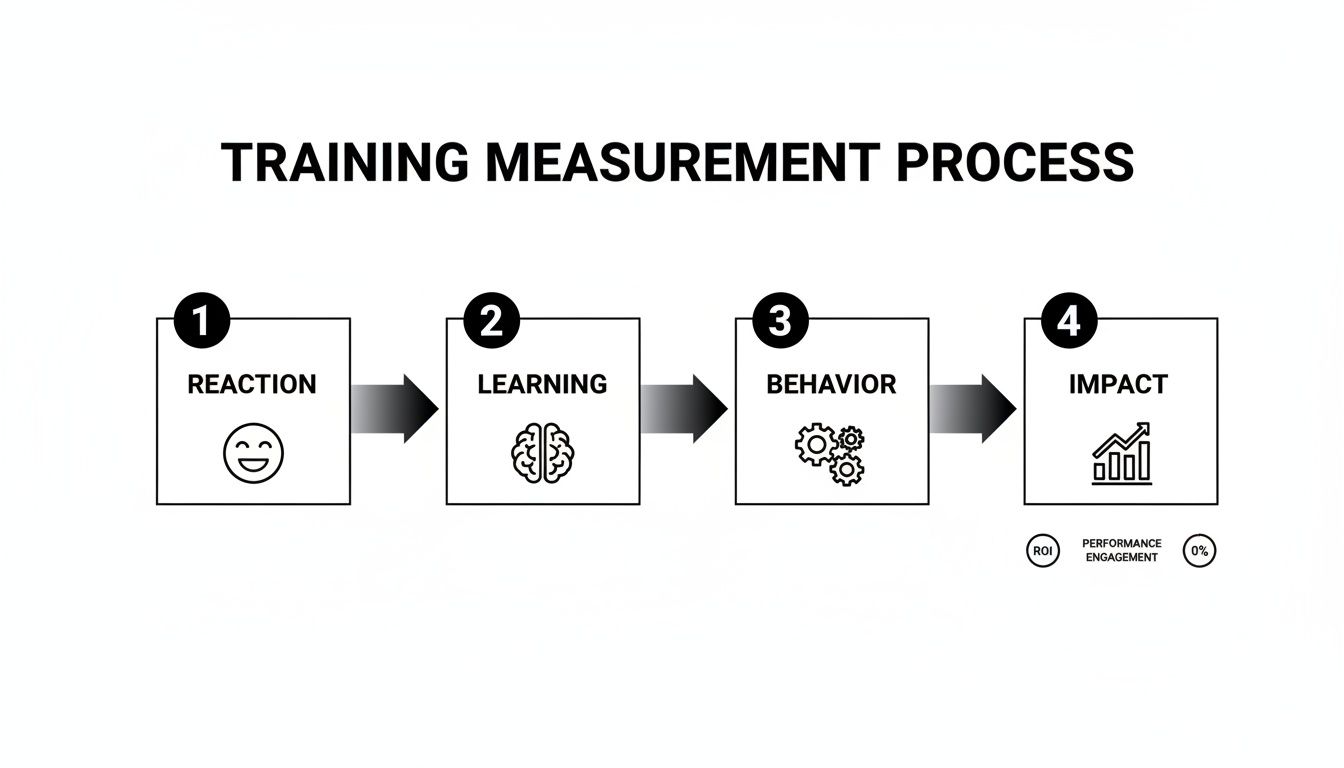
This framework gives you a clear roadmap, showing how evaluation deepens from initial reactions to long-term behavioral changes and bottom-line results. If you want a really thorough breakdown, this practical guide on how to measure training effectiveness is a fantastic resource.
Moving beyond simple "happy sheets" is critical. While knowing if employees enjoyed the training is useful, the real value lies in understanding if they learned, changed their behavior, and positively impacted the business.
To give you a clearer picture of how this all fits together, here’s a quick summary of the core evaluation levels.
A Quick Guide to Measuring Training Effectiveness
| Evaluation Level | What It Measures | Example Metric |
|---|---|---|
| Reaction | Participants' immediate feelings about the training. | Post-training satisfaction survey scores (e.g., 4.5/5). |
| Learning | The increase in knowledge or skills post-training. | Pre- and post-training assessment scores. |
| Behavior | The extent to which participants apply learning on the job. | Manager observations or performance reviews. |
| Impact | The final results and effect on business objectives. | Increased sales, reduced errors, or higher ROI. |
This table provides a high-level overview, but each level contains a lot of depth. We'll be digging into the specifics of how to measure each of these stages throughout the rest of this guide.
Sponsored by the makers
Tired of boring screen recordings?
Try Screen Charm.
Auto-zoom, motion blur, camera overlay, and background music. All built in. Record once, export a polished video.
See what it doesChoosing Your Measurement Framework
When you're trying to figure out how to measure training effectiveness, there’s no need to reinvent the wheel. Plenty of battle-tested models have been trusted by leading organizations for decades. Before you just pick one, though, it’s a good idea to get your head around the basic principles of performance measurement and how it works. Having that foundational knowledge makes it so much easier to choose and apply the right approach for your team.
The gold standard in this space is, without a doubt, the Kirkpatrick Model. Dr. Donald Kirkpatrick developed this framework way back in the 1950s, and it’s stuck around for a reason. It gives you a logical, four-level way to evaluate training, starting with how people felt about it and ending with the real-world business results.
Even today, research from Docebo shows that a staggering 71% of organizations still lean on this model to structure their evaluations. That tells you something about its staying power. You can dive deeper into these findings on training effectiveness from Docebo if you're curious.

Level 1: Reaction
The first level, Reaction, is all about capturing that immediate gut check from your participants. How did they feel about the training? Did they find it engaging? Was it relevant to their job?
This is usually done with post-training feedback surveys, and for good reason—92% of companies use them to get a quick pulse.
But don't just ask, "Did you like it?" That's a waste of an opportunity. To get feedback you can actually use, ask targeted questions that tie directly back to your learning goals. Think along these lines:
- Relevance: "How applicable was this content to your daily tasks on macOS?"
- Engagement: "On a scale of 1-10, how engaging did you find the instructor?"
- Clarity: "Was the material presented in a clear and understandable way?"
This feedback is your first signal. If the scores are low, you might have a problem with the content or the delivery that needs fixing fast. If you want to build better learning experiences from the ground up, check out these instructional design best practices.
Level 2: Learning
Next up is Level 2, Learning. This is where you measure what people actually took away from the session. Did they really pick up the knowledge, skills, or attitudes you were aiming for? This moves past simple satisfaction and starts to measure competence.
You can get at this with pre- and post-training assessments, quizzes, or even hands-on skill demonstrations.
For example, if you're training designers on a new macOS application like Sketch or Figma, don't give them a multiple-choice quiz. Give them a practical test where they have to design a simple interface. That’s far more revealing. The goal here is to measure the change in knowledge from before the training to after.
Level 3: Behavior
Level 3, Behavior, is where the rubber really meets the road. This level asks the million-dollar question: Are people applying what they learned back on the job? Honestly, this is the most critical stage. If learning isn't applied, it's just a wasted investment.
Getting this data usually involves a mix of methods:
- Manager Observations: Supervisors are in a great position to report on whether employees are using new techniques.
- Peer Feedback: Sometimes colleagues see behavioral changes even before a manager does.
- Performance Data: Look for hard numbers, like a drop in error rates or faster task completion times.
Just be patient. Observing behavior change takes time, so you'll likely need to follow up 30 to 90 days after the training wraps up.
Key Takeaway: The ultimate goal of training isn't just to transfer knowledge but to change on-the-job behavior. This level connects the classroom to the real world, providing tangible proof of application.
Level 4: Impact
Finally, there's Level 4, Impact. This is where you connect the dots between your training program and the company's bottom line. Did it lead to increased sales, higher productivity, or better customer satisfaction scores?
This is the data that gets executives' attention and justifies the L&D budget. It's not easy to measure—only 33% of organizations explicitly track the financial impact of their training—but it's absolutely essential for proving your strategic value to the business.
Gathering Data That Tells the Whole Story
Great measurement is about more than just numbers on a spreadsheet. To get a real sense of whether your training is hitting the mark, you need to look at both the "what" and the "why." This means blending hard data with genuine human insights to get the complete picture of your program's impact.
This is the classic distinction between quantitative and qualitative data.
Quantitative data gives you the objective, cold, hard facts—the numbers that tell you what happened. Think of things like course completion rates or final test scores.
Then you have qualitative data, which provides the essential context. It's the collection of stories, feelings, and firsthand observations that explain why something happened. This is the human side of the equation, and it's often where the most valuable insights live.
The Power of Quantitative Metrics
Quantitative data provides the irrefutable evidence of training effectiveness. When you’re training people on a macOS application, these numbers can be incredibly revealing. They're objective, simple to compare, and fantastic for tracking performance over time.
A smart move is to establish a performance baseline before anyone even starts the training. For example, if you're getting a support team up to speed on new features in your macOS app, you could measure their average ticket resolution time first. This gives you a clear benchmark to compare against once the training is done.
Here are some of the go-to quantitative metrics I always recommend tracking:
- Completion Rates: The most basic metric, but it tells you if people are actually finishing the course. A low completion rate is often the first red flag that something is wrong with engagement or relevance.
- Assessment Scores: Pre- and post-training tests are a direct line to measuring knowledge gain. A big jump in scores is a clear, undeniable sign that learning took place.
- Time-to-Competency: How long does it take for a new hire to become proficient after training? For instance, how many days or weeks until they can use a key feature in your macOS software without needing help?
- Error Reduction: Tracking a drop in user errors within your application after training is direct proof of improved skill and understanding.
Uncovering Insights with Qualitative Data
While the numbers are critical, they rarely tell the whole story on their own. That's where qualitative data becomes your secret weapon. It helps you understand the nuances behind the stats, giving you the rich context you need to make real, meaningful improvements.
Let's say your data shows that engagement plummets in one particular module. The numbers tell you what happened, but it's the qualitative feedback that will tell you why. Maybe the content was just plain confusing, or perhaps the examples didn't resonate with a macOS user's workflow.
True insight comes from combining objective data with subjective experiences. A 20% increase in test scores is great, but knowing why it happened allows you to replicate that success.
So, how do you get these valuable insights?
- One-on-One Interviews: There's no substitute for sitting down with participants and asking open-ended questions. What did they find most valuable? Where did they get stuck?
- Focus Groups: Getting a small group of learners together can spark a fantastic, dynamic conversation. You'll quickly uncover shared challenges and successes you might have otherwise missed.
- Manager Feedback: Managers see the day-to-day impact of training firsthand. Their observations on actual behavior change are an invaluable source of qualitative data.
Globally, corporate training is a huge investment, with spending in the U.S. alone topping $80 billion annually. Despite this, a D2L survey found that only 33% of organizations rigorously measure the financial impact of their training. Why? Often, it’s just too difficult to separate the effects of training from all the other variables in a business.
This gap really underscores the need for a blended data approach—it's how you build a convincing case for your training's value and improve your team's knowledge retention strategies.
Connecting Training Metrics to Business KPIs
Let's be honest. Data is just a bunch of numbers until you can weave it into a story that leadership actually understands. The real magic in measuring training effectiveness happens when you stop reporting on 'butts in seats' and start connecting your learning metrics to the key performance indicators (KPIs) that the business truly cares about. This is how you prove tangible, bottom-line value.
Think about it this way. You just rolled out a new training module for a feature in your macOS application, let's call it Screen Charm. Your L&D dashboard is glowing: an impressive 95% completion rate and an average post-assessment score of 92%. That feels like a win, right? But on its own, it doesn't tell a compelling business story.
To bridge that gap, you need to tie those learning achievements directly to what's happening on the ground. This usually means teaming up with other departments, like customer support, to compare their data from before and after your training went live.

From Learning Data to Business Impact
The trick is to isolate the impact of your program from all the other noise in the business. For instance, after your Screen Charm training, you might discover a 30% reduction in support tickets specifically related to that new feature. Now you have a clear, powerful narrative.
The training didn't just educate users; it directly reduced the support team's workload, freeing them up for more complex problems. That's a story that gets attention.
This approach transforms your L&D data from a simple report card into a rock-solid business case. Here’s a simple way to think about connecting the dots:
- Learning Metric: High assessment scores on a new macOS software feature.
- Behavioral Metric: Fewer user-generated error reports inside the app.
- Business KPI: A measurable drop in IT support tickets and associated costs.
This direct link is what proves your training's strategic value, making it much easier to get buy-in and budget for your next project. And the evidence backs this up. Rigorous evaluation can lead to a 10% average annual gain in employee performance, compared to just 6% for organizations that don't measure effectively. When you consider that U.S. firms spend over $80 billion on training each year, that difference is massive.
The ultimate goal is to draw a straight line from cause to effect. When you can confidently say, "We invested X in this training, which led to a Y improvement in this business KPI," you are speaking the language of leadership.
Presenting Your Findings Effectively
Once you have the analysis nailed down, how you present it is just as important. Please, don't just drop a spreadsheet into an email and call it a day. You need to build a narrative that walks stakeholders through the journey from learning to results.
For example, when reporting on your macOS application training, you could frame your story like this:
- The Challenge: "Our users were really struggling to adopt the new auto-zoom feature, and it was flooding our support team with requests."
- The Solution: "We rolled out a quick, targeted training module that focused on the exact workflows they needed within the macOS environment."
- The Outcome: "After the training, not only did proficiency scores jump by 40%, but we also saw a 30% decrease in support tickets for that feature. That saved the team an estimated 25 hours of support time every single week."
Telling the story this way cements L&D's role as a strategic partner and turns your data into a powerful tool for influence.
Navigating Common Measurement Challenges
Even the best-laid plans for measuring training effectiveness can hit a few bumps in the road. It’s one thing to design a solid strategy on paper, but it’s another thing entirely to deal with the messy reality of collecting data from real, busy people. Let's get into the most common headaches you'll likely face and talk about practical ways to keep your measurement plan from going off the rails.
A classic problem is simply not getting enough data to work with. You might create the perfect post-training survey for your new Screen Charm macOS application, but what if only 15% of the participants bother to fill it out? A response rate that low just isn’t enough to draw any meaningful conclusions.
Then there’s the challenge of getting buy-in from managers. They’re on the front lines and are your best bet for observing real behavior changes, but they often see feedback requests as just another item on an already overflowing to-do list. Without their insights, you’re missing a huge piece of the puzzle.

Boosting Engagement and Data Quality
When you're struggling with low survey response rates, the key is to make giving feedback as easy as possible. Let's be honest, no one is excited to fill out a 30-question survey. Keep your forms short, to the point, and make sure they work perfectly on any Mac or iPhone.
Automation is your best friend here. Set up a system to send an email reminder the day after training and maybe another one a week later. I find it helps to frame the request as their chance to shape future training. It makes people feel heard and more likely to respond.
For getting feedback from managers, you have to simplify the task. Don't just send a vague, open-ended email. Instead, give them a super-short checklist of 3-5 key behaviors to watch for. After a session on Screen Charm's video editing tools, for instance, you could ask them to look for:
- Are they using the new auto-zoom feature correctly?
- Has their time to produce a finished tutorial video gone down?
- Are they applying the new branding templates consistently?
This approach respects their time but still gets you the specific, actionable data you need.
Isolating the true impact of your training is probably the single hardest part of this job. A sales team's numbers might jump after a training session, but was that really because of your program? Or was it a new marketing campaign, a competitor's stumble, or just a seasonal shift? Correlation isn't causation.
Isolating Training's True Impact
To make a truly credible case for your training, the gold standard is using a control group. It’s a classic scientific method, and it works just as well in L&D. The idea is to provide training to one group of employees while temporarily holding it back from a similar group.
For example, you could roll out an advanced workflow training for your macOS application to just half of your customer support team. After 60 days, you compare their key metrics—like ticket resolution times or customer satisfaction scores—against the group that didn't get the training.
If the trained group shows a much bigger improvement, you’ve got some powerful evidence that your program was the real driver of that change.
This isn't always possible to pull off, but when it is, it provides the strongest proof of your training's direct impact. When you can walk into a meeting with that kind of clear, comparative data, the conversation shifts. You're no longer saying, "We think the training helped." You're saying, "We have evidence the training increased efficiency by 18%." That's how you prove your value and secure the budget for your next big initiative.
Your Questions, Answered
Even the best-laid plans come with questions once you start putting them into action. Let's tackle some of the most common ones we hear from folks trying to measure the real impact of their training.
How Often Should I Measure Training Effectiveness?
Measuring training impact isn't a one-and-done deal. It's more like a series of checkpoints, each timed to capture a different piece of the puzzle. You have to think in stages.
For example, say you just ran a training on a new feature in your macOS app. You’d want to measure reactions (Level 1) with a quick survey the moment the session ends. You'd also assess learning (Level 2) with a short quiz right away, and maybe again two weeks later to see what actually stuck.
Real behavioral changes (Level 3) don't happen overnight. You'll need to give it some time, observing how people work 30 to 90 days after the training. This gives them a fair chance to put their new skills into practice. As for the big-picture business impact (Level 4), that's a longer game. You'll want to review that quarterly or even annually to see how it lines up with your company's major business cycles.
What Is the Single Most Important Metric to Track?
Everyone wants to know the one "magic" metric, but honestly, it doesn't exist. The most important metric is always the one that ties directly back to the business problem you were trying to solve in the first place.
If you're running a compliance course, completion rates and test scores are non-negotiable. But for a sales training program? The real story is told by an increase in revenue or a shorter sales cycle. For that macOS app training we mentioned, you'd be looking for a reduction in support tickets or a faster adoption rate of the new feature.
The best advice I can give is to always start with the end goal. Figure out the business outcome you need to influence, then work backward to find the single metric that proves you got there. That’s your north star.
How Can I Measure the Effectiveness of Soft Skills Training?
This is a tough one. Measuring things like leadership or communication can feel a bit fuzzy, but it's entirely doable. The trick is to focus less on knowledge checks and more on observable behavioral change (Level 3) and qualitative feedback.
One of the most powerful tools for this is 360-degree feedback. Before the training, survey a manager's direct reports, peers, and their own boss. Then, do it again three to six months later. This gives you a fantastic, multi-faceted view of how their behavior on the job has actually changed from others' perspectives.
You can also tie it back to concrete business outcomes. For instance, does leadership training for a group of managers correlate with higher team retention rates? Do you see a bump in their team's employee engagement scores on the annual survey? Connecting soft skills to these tangible KPIs makes their value crystal clear to everyone.
What Tools Can Help Me Measure Training Effectiveness?
Having the right tech stack makes a world of difference. Your Learning Management System (LMS) is your home base, perfect for tracking the basics like completion rates and quiz scores.
When it's time to gather feedback, you don't need anything fancy. Simple tools like SurveyMonkey or Google Forms work beautifully for creating and sending out post-training surveys.
To really connect the dots between your training data and actual business performance, you'll want to look at a business intelligence (BI) tool. Platforms like Tableau or Power BI are game-changers. They let you pull data from your company's HRIS or CRM and create a unified dashboard, painting a complete picture of your training's impact across the entire organization.
Ready to create stunning product demos and tutorials on your Mac without the steep learning curve? Screen Charm offers an intuitive solution with its signature auto-zoom and integrated editor, empowering you to produce professional-quality videos effortlessly. Get started today and captivate your audience. Learn more and get Screen Charm for a one-time price.